
Breakout stocks are highly sought after by traders due to their potential for rapid price movement and high returns. Whether you’re a novice or an experienced trader, understanding how to identify breakout stocks and the strategies to trade them can significantly enhance your trading success.
This article will explore the fundamentals of breakout stocks, the various types, real-world examples, and strategies to trade them effectively.
What are Breakout Stocks
A breakout stock is a stock whose price moves beyond a defined support or resistance level, often accompanied by an increased trading volume. This movement can indicate the beginning of a significant upward or downward trend. The breakout signals that the stock can maintain its momentum in in the same direction, providing traders with potential profit opportunities.
Key components of breakout stocks:
- Support level: A price level where a stock consistently finds buying interest and doesn’t fall below easily.
- Resistance level: A price level where the stock struggles to move beyond due to selling pressure.
- Volume surge: The breakout is more reliable if there’s a noticeable increase in trading volume, confirming market interest.
For example, suppose a stock has consistently traded between $50 (support) and $60 (resistance). When it breaks past $60 with increased volume, traders may view this as a bullish breakout, expecting further upward movement.
Why are Breakout Stocks Important?
Breakout stocks are essential for both day traders and long-term investors, as they often mark the onset of significant market trends. Here are some benefits of identifying breakout stocks
- Early trend detection: Breakout stocks help investors and traders identify the early stages of new trends. When a stock price breaks through a significant resistance or support level, it often signals the beginning of a new upward or downward trend.
- Potential for rapid gains: For active traders, breakouts offer numerous profit opportunities. The initial surge in price following a breakout can lead to sustained trends, allowing traders to capitalise on the momentum. Additionally, breakouts can lead to rapid price appreciation, providing opportunities for quick gains.
- Volatility and momentum: Breakouts are typically accompanied by a spike in trading volume and increased price volatility. This heightened activity can lead to significant price movements, offering traders the potential for substantial gains. The increased volume also adds credibility to the breakout, suggesting that it is supported by a broad base of market participants.
Types of Breakout Stocks
Breakouts can occur in several forms based on market dynamics and a stock’s price behaviour. Understanding these different types helps traders identify potential trading opportunities and refine their strategies for entering or exiting positions. Here’s a deeper look into each type:
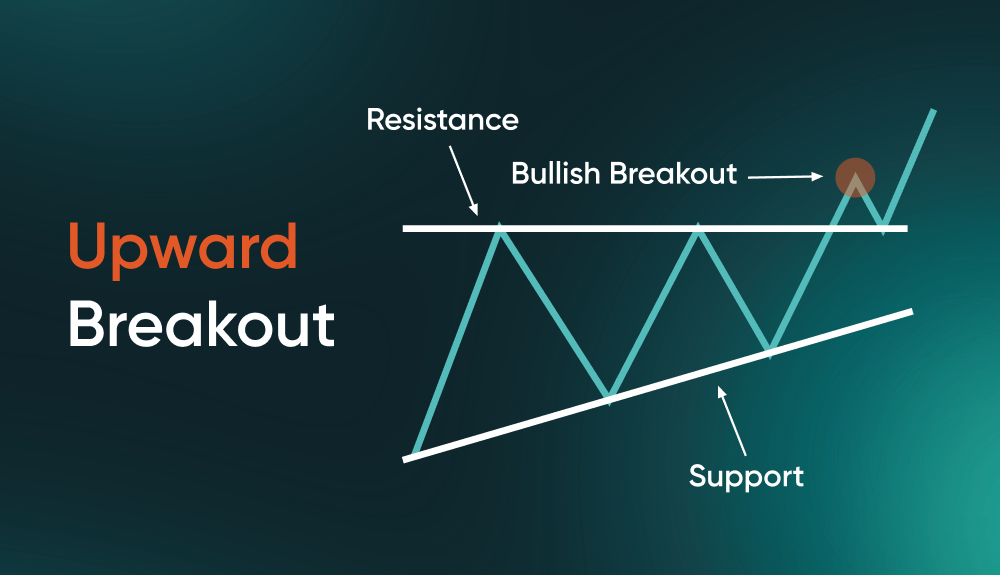
1. Upward Breakout (Bullish Breakout)
An upward breakout, also known as a bullish breakout, occurs when a stock’s price moves above a well-established resistance level. This breakout signals the potential beginning of a bullish trend, where traders anticipate further upward movement. These breakouts are often accompanied by increased volume, indicating strong buying interest and market momentum.
Key considerations for upward breakouts:
- Volume surge: A breakout is more reliable when accompanied by a significant increase in buying volume. Without a volume confirmation, the breakout may lack strength and could reverse quickly.
- Market sentiment: Upward breakouts often occur in bull markets or when positive news, such as earnings beats or product launches, spurs investor confidence.
- Confirmation signals: Traders can confirm an upward breakout using technical indicators such as RSI or Moving Averages to ensure that the breakout is supported by momentum.
Example:
Imagine a stock has been trading within a range of $45 to $50, with $50 acting as the resistance level. After a positive earnings report, the stock surges past $50 with high volume, signalling an upward breakout. Traders might enter long positions, expecting the price to continue rising.
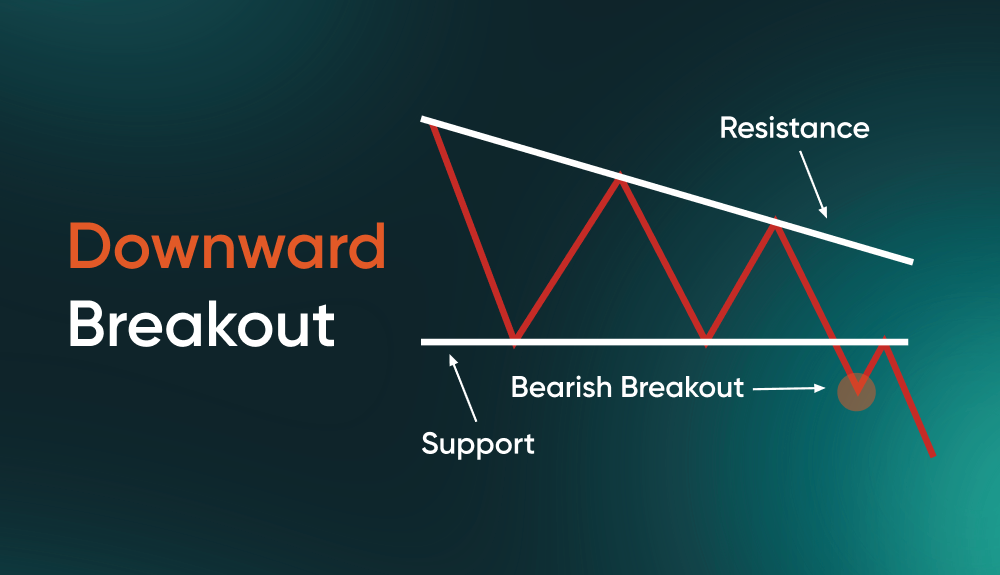
2. Downward Breakout (Bearish breakout)
A downward breakout occurs when a stock’s price falls below a key support level, signalling the start of a bearish trend. Traders often take this as an opportunity to short the stock or exit any existing long positions to avoid further losses.
Key considerations for downward breakouts:
- Panic selling: Downward breakouts can trigger panic among traders and investors, leading to accelerated selling pressure and further price declines.
- Fundamental drivers: These breakouts are often spurred by negative news such as earnings misses, market downgrades, or broader economic concerns that dampen market sentiment.
- Volume confirmation: As with upward breakouts, a downward breakout is more reliable when accompanied by a strong selling volume.
Example:
Consider a stock that has been holding support at $100. After disappointing quarterly results, the stock breaks below the $100 level, triggering a downward breakout. Short-sellers may enter positions, anticipating that the price will continue to fall.
3. False Breakout
A false breakout occurs when a stock’s price momentarily breaks through a key support or resistance level but fails to sustain the movement, reversing direction shortly after. False breakouts can trap traders who enter too early, leading to losses if the stock fails to maintain the breakout.
Key considerations for false breakouts:
- Premature entry: False breakouts often lure traders into positions before the breakout is confirmed, only for the price to quickly reverse, leading to losses.
- Lack of volume: False breakouts typically occur when the breakout is not accompanied by sufficient volume to support the move, indicating weak market interest.
- Risk management: It’s essential to wait for confirmation (e.g., volume, technical indicators) before entering trades based on breakouts.
Example:
A stock may break above a resistance level at $80 but quickly reverse and fall back below that level within the same trading session. Traders who entered too early may experience losses as the price fails to hold above the resistance.

Examples of Breakout Stocks
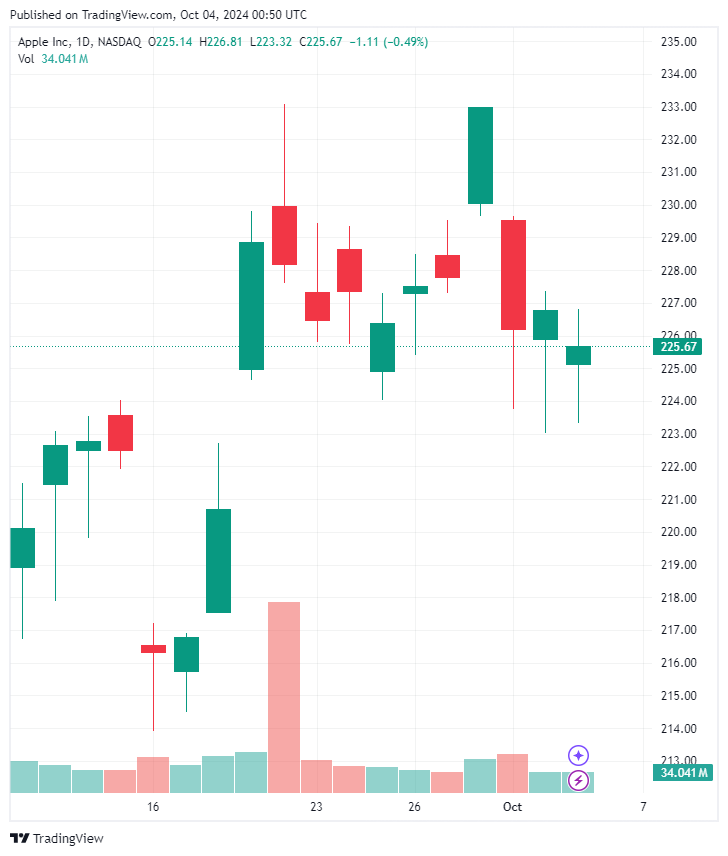
Apple Inc. (AAPL)
Apple has consistently been a breakout stock, especially around key events such as earnings reports, product launches, and industry shifts. Traders often look to capitalise on Apple’s price movements during these periods, given its strong market influence and brand loyalty.
Notable AAPL breakouts:
June – July 2024: During this period, AAPL shares surged by 8%, reaching an all-time high of $237 in mid-July. This can be attributed to the announcement of Apple Intelligence, a comprehensive software overhaul introducing AI features across Apple’s product lineup [1].
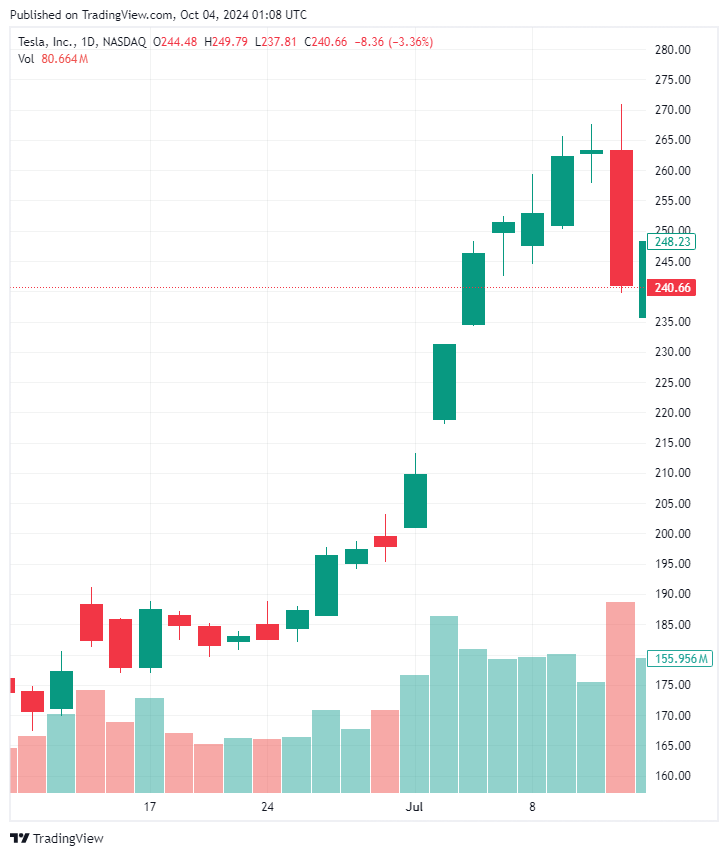
Tesla Inc. (TSLA)
Tesla’s stock has had several upward breakouts following positive news on electric vehicle adoption and earnings beats. The company is a prime example of a stock that breaks out due to high investor sentiment.
Notable TSLA breakouts:
July 2024: Tesla stock saw a breakout on 28 July when the stock surged 27% in a single week, driven by a better-than-expected Q2 deliveries report and anticipation for the upcoming Robotaxi Day. This breakout saw Tesla shares closing above both the 50- and 200-week moving averages [2].
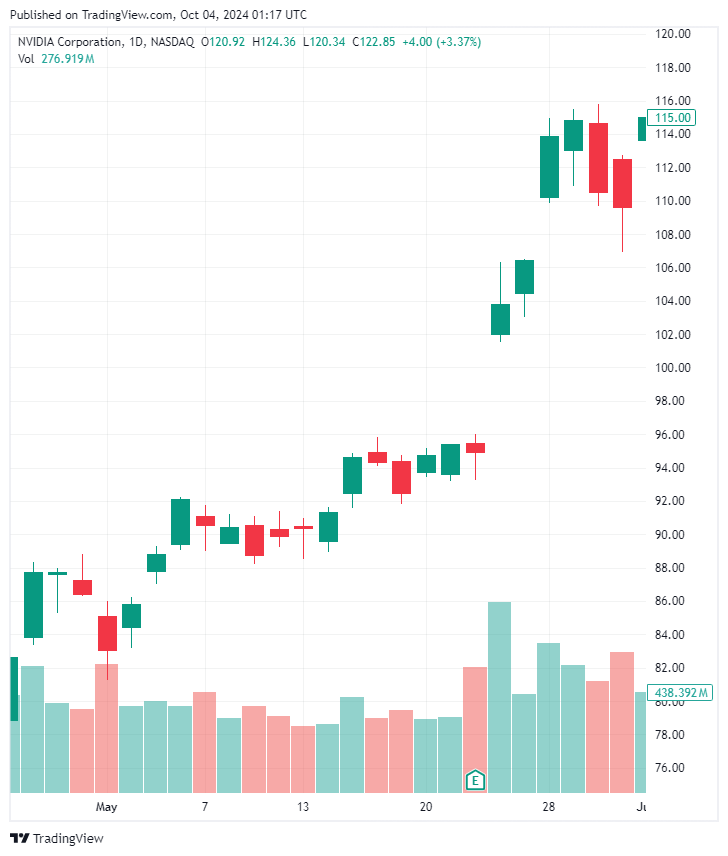
Nvidia Corp. (NVDA)
As a leading player in the semiconductor industry, Nvidia has seen multiple breakouts driven by product innovations, earnings reports, and its dominance in markets such as gaming, artificial intelligence (AI), and data centres. Nvidia’s stock often rallies during bullish tech market periods or when it releases cutting-edge technology that leads the industry.
Notable NVDA breakouts:
May 2024: Nvidia experienced a breakout in May 2024 following a strong earnings report. The stock jumped 7.4% to reach $1,020 per share on 23 May. This surge was driven by a strong financial performance and the announcement of a 10-for-1 stock split [3].
Effective Strategies for Trading Breakout Stocks
Successfully trading breakouts requires not only technical analysis but also effective timing and sound risk management.
Below are several strategies traders employ to navigate breakout opportunities:
Volume Confirmation
Volume is a critical indicator when assessing the strength of a breakout. A price movement accompanied by high trading volume suggests strong interest and commitment from investors, making it more likely that the breakout will continue.
- Volume Analysis: Traders typically look for a volume surge that is at least 50% higher than the average volume over the previous few days. This spike indicates increased activity and interest in the stock [4].
- Volume Oscillator: Tools like the Volume Oscillator can help traders identify changes in volume trends relative to price movements. A significant increase in volume alongside a price breakout often reinforces the validity of the move.
Moving Average Crossover
Moving averages are valuable tools for confirming breakouts. Commonly used averages include the 50-day and 200-day moving averages. A stock price crossing above these averages can indicate a shift in market sentiment, signalling a potential new trend.
- Simple Moving Average (SMA) and Exponential Moving Average (EMA): The SMA provides a lagging indication of price direction, while the EMA reacts more quickly to price changes. Traders often watch for crossovers where a short-term EMA crosses above a longer-term SMA.
- Golden Cross: A specific signal occurs when the 50-day moving average crosses above the 200-day moving average, often indicating the start of a bullish trend.
Stop-Loss Placement
Proper risk management is crucial when trading breakouts, especially to mitigate potential losses from false breakouts. Placing stop-loss orders strategically can help protect capital.
- Position Sizing: Determine the appropriate size of your position based on your risk tolerance and the distance to your stop-loss. This ensures you can withstand minor fluctuations without significant losses.
- Setting Stop-Loss Orders: Place stop-loss orders just below the breakout point or support level. For instance, if a stock breaks out above $70, consider placing a stop-loss order around $68 to limit potential losses.
Trendline Breakouts
Trendlines are a fundamental tool in technical analysis. Traders can use trendlines to visually identify breakout points, which can indicate bullish or bearish trends.
- Drawing Trendlines: Draw lines connecting higher lows in an uptrend or lower highs in a downtrend. A breakout occurs when the price moves above a downward trendline (bullish) or below an upward trendline (bearish).
- Confluence of Signals: Combine trendline analysis with other indicators such as volume or moving averages to enhance the reliability of the breakout signal.
Conclusion
Breakout stocks offer exciting opportunities for traders to capitalise on significant price movements, potentially leading to rapid gains when timed correctly. By mastering key strategies like volume confirmation, moving average crossovers, and effective risk management, you can navigate breakout trades with greater confidence and precision.
Ready to put these strategies into action? Open a live account with Vantage today and start trading breakout stocks via CFDs. Contracts-for-Difference (CFDs) allow you to speculate on the price movements without owning the underlying assets.
Not ready to open a live account? Try our free demo account and seize market opportunities with the right tools and insights at your fingertips. Begin your trading journey now!
References:
- “Apple Stock Soars to New Peak. Here’s Why I’m Doubling Down. – The Motley Fool”. https://www.fool.com/investing/2024/07/21/apple-stock-soars-to-new-peak-heres-why-im-doublin/. Accessed 4 September 2024.
- “Watch These Tesla Stock Price Levels After Last Week’s Huge Rally – Investopedia”. https://www.investopedia.com/watch-these-tesla-stock-price-levels-after-huge-rally-8674432. Accessed 4 September 2024.
- “Nvidia announces 10-1 stock split. Here’s what it means for investors – Yahoo!Finance”. https://finance.yahoo.com/news/nvidia-announces-10-1-stock-165831783.html. Accessed 4 September 2024.
- “Relative Volume Explained: Elevate Your Trading Strategy for Peak Performance – Chart Spots”. https://www.chartspots.com/relative-volume-explained-elevate-your-trading-strategy-for-peak-performance/. Accessed 4 September 2024.


